Device visibility with a person behind the next action.
01
Know what is happening
See the agreed health and availability signals for covered devices.
02
Give alerts an owner
Connect significant alerts to review and escalation.
03
Plan capacity earlier
Use trends to guide maintenance and investment.
WHAT THIS LOOKS LIKE FOR YOUR BUSINESS
An alert is useful when someone owns it.
Monitoring connects device health to a response process. We agree what to watch, who acts, and how findings feed into a more reliable operation.
Explore a situation. See how the work connects.
SERVICE IN ACTIONIllustrative workflow
Turn a signal into an owned next action.
Detect
A configured health check identifies a condition.
Review
Assess impact, context, and maintenance activity.
Coordinate
Route the response and verify agreed checks.
What we own
Alert review, coverage hours, authority to act, and escalation follow your service agreement.
A documented response with clear responsibility.
Use the trend before making the next investment.
Observe
Review storage or resource trends.
Assess
Connect the pattern to workloads and demand.
Plan
Agree maintenance or a capacity change.
What we own
We bring capacity findings and dependencies into service reviews and planning.
An informed decision grounded in the monitored environment.
CAPABILITY WITH CLEAR OWNERSHIP
A watchful eye on the devices that keep you running.
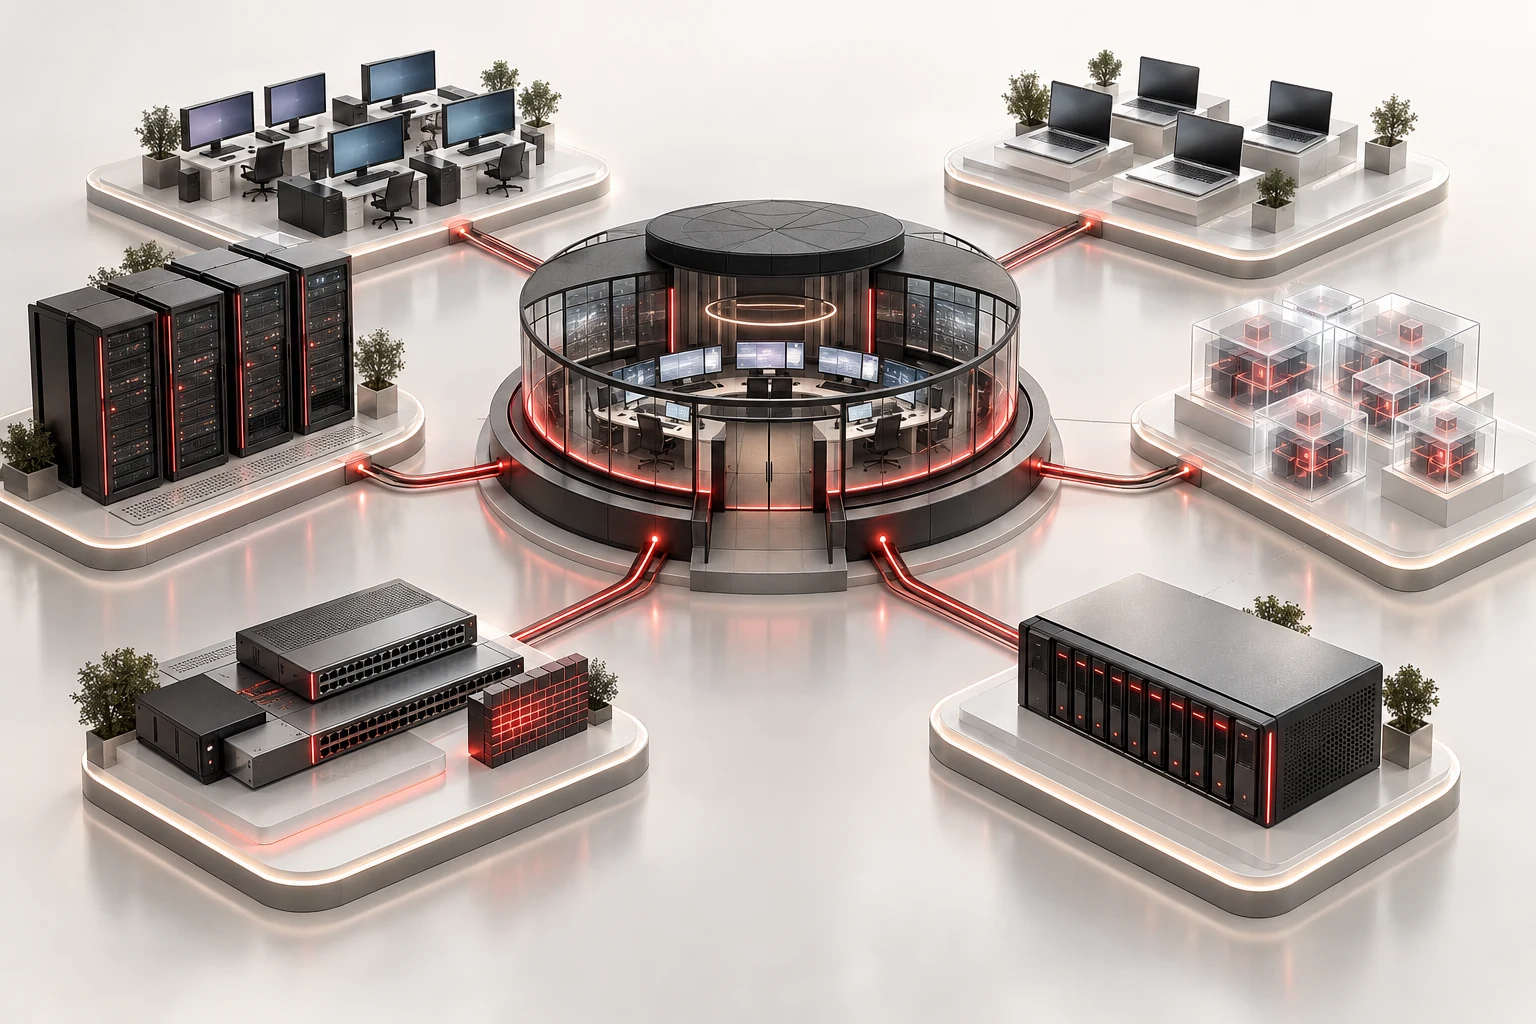
Build monitoring around your actual mix of PCs, Macs, servers, VMs, and network equipment.
01 / SERVICE AREA
Monitor your devices
PCs, Macs, servers, VMs, and network equipment.
Windows PCs & Macs
Physical servers & guest VMs
Network peripherals, storage & appliances
Scope & technical details
Windows PCs
Desktops & laptops
Availability and management-agent health
Storage, system resources, and selected services
Patch or protection status where integrated
Macs
macOS desktops & laptops
Device check-in and supported health signals
Storage and resource conditions
Supported update and management status
Physical servers
Windows, Linux & supported hosts
CPU, memory, disks, and critical services
Hardware or storage health where exposed
Host availability and capacity trends
Virtual machines
Individual guest workloads
Guest OS health and service availability
Virtual disk, CPU, and memory utilization
Workload dependencies and host relationships
Network peripherals
Firewalls, switches, routers & Wi-Fi
Device reachability and interface conditions
Connectivity and performance signals
Supported logs and configuration-related alerts
Storage & other devices
NAS, appliances, printers & UPS
Supported capacity and hardware status
Power, battery, or device conditions where exposed
Device-specific checks confirmed in discovery
02 / SERVICE AREA
Prioritize the signal
Understand what matters to the business.
Availability & resource checks
Thresholds matched to real workloads
Context and business-impact review
Scope & technical details
Asset discovery & monitoring design
Identify the systems to monitor, their business purpose, ownership, dependencies, and supported methods of collecting health signals.
Availability & performance monitoring
Watch agreed availability, resource, capacity, and service signals. Build thresholds around how the systems are used and what the business needs.
Alert review & prioritization
Review alerts in context, distinguish expected maintenance from an incident, and prioritize by impact, urgency, and affected dependencies.
03 / SERVICE AREA
Coordinate the response
Connect alerts to a responsible person.
Named responders & escalation routes
Approved remediation & runbooks
Provider and internal-team handoffs
Scope & technical details
Escalation & coordinated response
Route the issue to the agreed Logic Networks team, internal IT owner, or third-party provider. Follow the escalation path and keep the responsible people informed.
Maintenance & remediation coordination
Connect findings with approved runbooks, patching, corrective work, or a separately scoped project. Define who can change what and when before action is taken.
04 / SERVICE AREA
Improve reliability
Use recurring issues to guide maintenance.
Recurring-issue & capacity reviews
Maintenance and exception tracking
Reporting and roadmap priorities
Scope & technical details
Operational reporting & improvement
Review recurring alerts, unresolved risks, capacity concerns, and service exceptions. Use the findings to improve monitoring and plan useful changes.
Capacity trends and recurring alerts
Exception tracking
Review priorities and roadmap inputs
24/7 monitoring and staffed response are separate. Your agreement defines review hours, after-hours escalation, response targets, and authorized remediation.
THE LOGIC NETWORKS DIFFERENCE
Engineers behind the alerts.
A busy dashboard should not become another job for your staff. We connect device signals to context, response ownership, and maintenance decisions, so the right people know what needs attention.
Use a separate quantity for each device type. A physical host and its guest VMs are different monitoring targets. We confirm inventory, compatibility, and overlap with Managed IT.
How is the service scoped?
24/7 monitoring and staffed response are separate. Your agreement defines review hours, after-hours escalation, response targets, and authorized remediation.
What happens in the consultation?
Start with approximate device counts and the issues you want better visibility into. We discuss priorities, identify what needs discovery, and agree a useful next step. Any assessment, proposal, or implementation scope is confirmed together.
YOUR NEXT STEP
Let’s map what needs watching.
Start with approximate device counts and the issues you want better visibility into.